
A lender evaluating AI for borrowers with little credit history needs to distinguish two changes: a different prediction method and a different source of information. If both change together, a better result cannot tell the team which change helped. Credit Garden's next Charlie Bucket comparison should make that distinction visible before turning a prediction improvement into a lending claim.
This is a focused research explainer, not a new Credit Garden experiment or meta-analysis. The external results below concern loans already made in another market. They help design a comparison; they do not establish performance for Caribbean applicants.
What a same-data comparison reveals
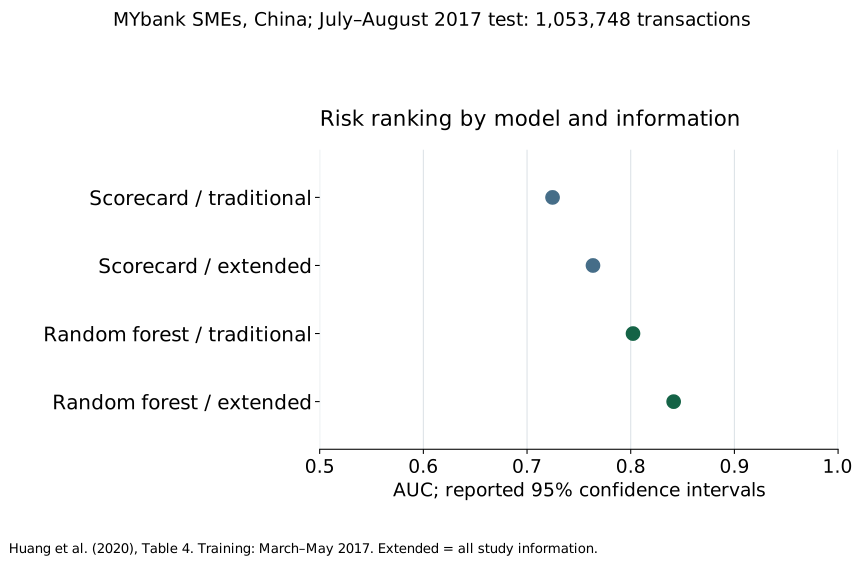
Huang and colleagues' September 2020 IMF working paper compared scorecard and random-forest models with traditional information and with a broader information set. It used Chinese MYbank small-business loans from March to August 2017. Models were trained on March–May loans and tested on 1,053,748 loan transactions from July–August. Table 4 reports AUC, a measure of risk ranking, and confidence intervals for four combinations. A higher AUC separates defaults from non-defaults better; it does not establish accurate default probabilities. [1]
The chart separates the information set from the algorithm. Its estimates describe the full study test sample, not a thin-file-only evaluation. They are not Credit Garden results. More precise risk ranking in these data does not by itself establish suitable loan terms, fairer decisions or better financial health.
| Model | Information | AUC | 95% interval |
|---|---|---|---|
| Scorecard | Traditional | 0.7246 | 0.7222–0.7269 |
| Scorecard | All study information | 0.7636 | 0.7615–0.7658 |
| Random forest | Traditional | 0.8022 | 0.8001–0.8043 |
| Random forest | All study information | 0.8414 | 0.8396–0.8433 |
A useful comparison keeps the applicants, permitted information and outcome window fixed while changing the method. A second comparison can add a candidate data source to each method. This design gives the team a way to assess whether collecting that information adds enough value to justify its cost and privacy implications.
Define thin-file before measuring performance
A borrower with a short bureau record is different from a borrower without any bureau record. Neither description tells the lender whether the person has regular income, an existing bank account or an affordable proposed repayment schedule. Write the operational definition before selecting the evaluation sample. Retain separate groups when their available evidence differs.
The same care applies to the comparison model. A weakly configured scorecard can make a complicated model look attractive without showing that complexity is necessary. Give both approaches the same usable information at the decision date, sensible development effort and an outcome that has had time to emerge. Keep later repayment activity out of the inputs used to predict an earlier decision.
A BIS working paper based on Chinese fintech transactions in 2017 found that the advantage of its machine-learning and non-traditional-data approach tended to decrease as borrowers had a longer credit history. That is a result about its particular setting and credit-history measure. It supports testing the groups separately, rather than assuming that every applicant benefits equally from the same data strategy. [2]
Test the lending decision as well as the ranking
AUC measures ordering. A lender also needs to know whether estimated probabilities match observed outcomes, which applicants are offered credit and what happens at the chosen terms. Agree the decision rule before examining the final test results. Report who changes from refusal to approval and who moves in the opposite direction.
Compare decisions at a clearly stated constraint, such as the same approval rate or a specified portfolio-risk limit. Those comparisons answer different questions. Preserve both the denominator and the cost definition when reporting losses. A loan-count default rate cannot silently become a percentage reduction in money lost.
An evaluation of rejected applicants has an additional limit: the repayment outcome of a loan never made is not observed. Predictions about that group remain predictions. A proposed evaluation needs a defensible way to obtain evidence, appropriate authorisation and customer safeguards; generating plausible borrower records cannot supply observed repayment outcomes.
Greater accuracy does not settle fairness
Fuster and colleagues compared models using US mortgage data and found that predictive improvements did not benefit demographic groups equally. Their published study distinguishes greater model flexibility from the ability to infer excluded characteristics through other variables. The findings do not identify an effect for Caribbean borrowers. They explain why a team should inspect the distribution of decisions alongside overall accuracy. [3]
For a proposed Charlie Bucket evaluation, document which group comparisons are lawful, appropriate and supported by enough observations. Examine error patterns and decision changes, including uncertainty. An apparent improvement in the average can coexist with a harmful change for a smaller group. If group information is unavailable or an estimate is too imprecise, report that limit rather than certify the model as fair.
A customer also needs a route to correct an input. Test whether the explanation names the information actually used and whether a correction reaches the responsible decision-maker. An explanation generated after the decision must not invent a persuasive reason for it.
What Credit Garden has established so far
The inspected Credit Garden adjudication deck, last modified in January 2022, described Charlie Bucket as entering live testing. That is dated company-reported development status. It is not evidence of current deployment, a completed controlled evaluation or a reduction in loan losses.
The existing Charlie Bucket review separates ranking, fairness and financial health. The financial-well-being article addresses whether a measure can be interpreted locally. This comparison adds another question: would the proposed model still improve the decision when the data, test population and rules are held constant?
The US agencies' revised model-risk guidance of April 2026 discusses model validation and outcomes analysis. It is an external methodological reference with a US supervisory scope, not a statement of Caribbean legal duties. Credit Garden and any lending partner still need to identify their own applicable requirements. [4]
Prepare the comparison before the next test
A useful next step is a comparison record that a model developer, credit officer and reviewer can all inspect. Specify the borrower groups, decision date, outcome and observation window. Name the baseline and candidate methods, their permitted inputs and the conditions under which either would be stopped or revised.
Keep model accuracy, review effort, borrower access and financial health as separate outcomes. Record the evidence needed for each claim and who owns the next decision. Until authorised local outcome data and a completed evaluation are available, the honest research output is that comparison plan and the external evidence informing it.
Sources and scope
[1] Huang, Zhang, Li, Qiu, Sun and Wang, Fintech Credit Risk Assessment for SMEs: Evidence from China, IMF Working Paper 20/193, September 2020. Data description, baseline and Tables 3–4 inspected, printed pages 15–22. Working paper, not a new Credit Garden finding. https://www.imf.org/-/media/files/publications/wp/2020/english/wpiea2020193-print-pdf.pdf
[2] Gambacorta, Huang, Qiu and Wang, How do machine learning and non-traditional data affect credit scoring? New evidence from a Chinese fintech firm, BIS Working Paper 834, 19 December 2019. Official research summary inspected; no numeric effect extracted. https://www.bis.org/publications/working-paper-834-how-do-machine-learning-and-non-traditional-data-affect-credit-scoring-new-evidence-chinese-fintech-firm
[3] Fuster, Goldsmith-Pinkham, Ramadorai and Walther, Predictably Unequal? The Effects of Machine Learning on Credit Markets, Journal of Finance 77(1), 2022; first published 28 October 2021. Introduction and model/data definitions inspected. https://doi.org/10.1111/jofi.13090
[4] Federal Reserve, OCC and FDIC, Revised Guidance on Model Risk Management, 17 April 2026. Official letter and stated US scope; attached guidance, validation and outcomes analysis, pages 7–9. https://www.federalreserve.gov/supervisionreg/srletters/SR2602.htm
Company status comes from an inspected internal presentation; only this public summary is reproduced. External sources were selected through targeted primary-source searches for matched model/data comparisons and distributional limits, checked 3 November 2026. This is a narrative methods explainer, with no exhaustive screening, pooled effect, new borrower experiment or empirical Credit Garden result. Prepared with AI assistance and editorial source checks.
More from Credit Garden. Add this site as a preferred source on Google.